If you’ve ever spent hours manually comparing Google Ads and Meta Ads reports, you know how tedious this process can be. Copy-pasting data, aligning columns, and calculating metrics by hand is not only time-consuming but also prone to errors. It’s a task that should be automated — especially when you’re managing multiple campaigns across platforms.
The Manual Way (And Why It Breaks)
Most developers and marketers dealing with ad performance data rely on spreadsheets or manual export/import methods to compare results. You might open one CSV from Google Ads, another from Meta Ads, then spend a good chunk of your day aligning fields like campaign name, spend, clicks, and conversions. If you’re lucky, you’ll have consistent column names — but often, they don’t match. And when you do get that data aligned, you still have to run formulas to calculate ROAS, CPA, or CTR across platforms. That’s assuming you don’t hit API rate limits while pulling data, or spend time figuring out which fields are missing when reports arrive with odd formatting.
The Python Approach
Here’s a simple Python script that shows how you might start to automate this. It reads two CSVs, normalizes some of the data, and calculates basic metrics.
import pandas as pd

# Load Google Ads and Meta Ads CSVs
google_ads = pd.read_csv('google_ads_data.csv')
meta_ads = pd.read_csv('meta_ads_data.csv')

# Normalize column names
google_ads.rename(columns={'Cost': 'Spend', 'Conversions': 'Conversions'}, inplace=True)
meta_ads.rename(columns={'spend': 'Spend', 'conversions': 'Conversions'}, inplace=True)

# Merge datasets
combined = pd.concat([google_ads, meta_ads], ignore_index=True)

# Calculate CPA and ROAS
combined['CPA'] = combined['Spend'] / combined['Conversions']
combined['ROAS'] = combined['Conversions'] * 10 / combined['Spend']  # assuming 10 value per conversion

# Save results
combined.to_csv('combined_performance.csv', index=False)
This basic script takes two CSVs and merges them, calculates simple KPIs, and exports a unified file. However, it assumes clean, consistent data — which rarely happens in the real world. It doesn’t check for missing fields, nor does it support multiple date ranges or filters. You’d quickly run into issues if campaigns were in different currencies or if data from one platform was missing critical fields.
What the Full Tool Handles
The PPC Campaign Performance Analyzer goes beyond the basics:
- Takes CSVs from Google Ads, Meta Ads, and Microsoft Advertising
- Automatically detects missing or unexpected columns
- Normalizes and aligns data across platforms
- Supports filtering by date range, campaign name, or status
- Outputs in JSON, CSV, and Markdown formats
- Handles inconsistent naming and missing data gracefully
- Provides CLI interface for easy execution
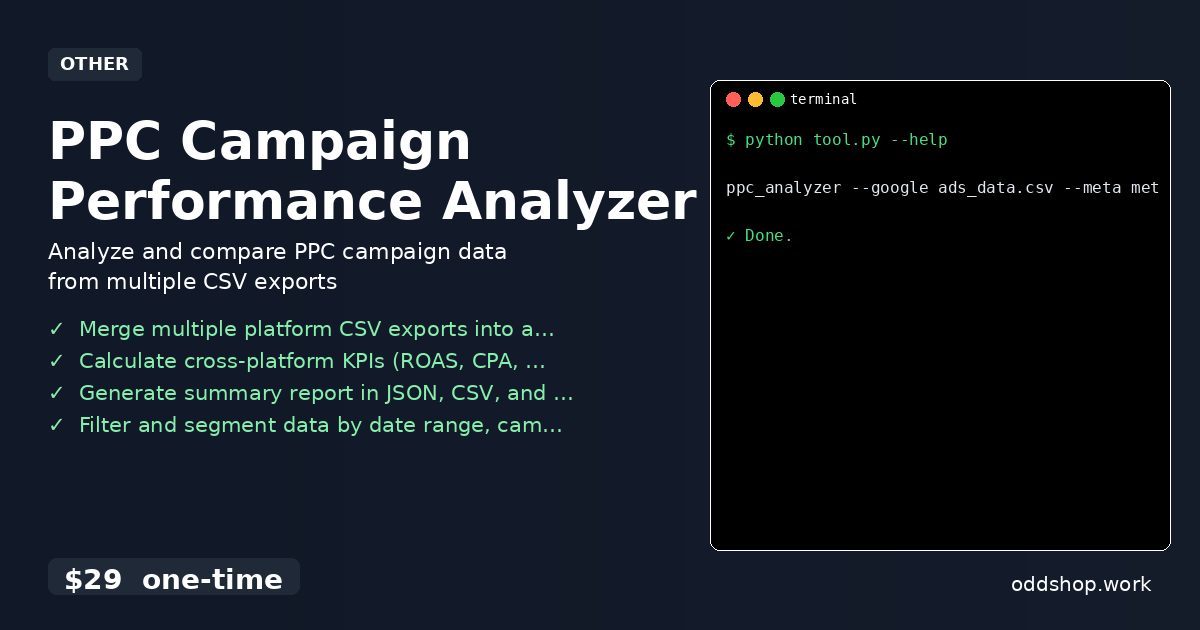
Running It
Using the tool is simple. Here’s how you’d run it from the command line:
ppc_analyzer --google ads_data.csv --meta meta_data.csv --output report.json
You can also add filters like:
ppc_analyzer --google ads_data.csv --meta meta_data.csv --start 2024-01-01 --end 2024-01-31 --output report.json
The output will include a clean summary report in the format you specify. It includes aggregated KPIs like total spend, conversions, CPA, and ROAS across all campaigns.
Results
With this approach, you cut hours of manual work into minutes. The script produces a clean, standardized report that can be used for dashboards or further analysis. It eliminates human error and ensures consistent calculations across platforms.
Get the Script
You don’t need to build this yourself — the tool is ready to go. Skip the trial and error, and use a polished solution that handles everything from data normalization to reporting.
Download PPC Campaign Performance Analyzer →
$29 one-time. No subscription. Works on Windows, Mac, and Linux.
Built by OddShop — Python automation tools for developers and businesses.