Python spreadsheet automation tools can save you from drowning in raw data. But when you’re crunching user retention from CSVs, the manual steps quickly become a bottleneck. This is where python excel automation meets real-world productivity — especially when you’re building automated reporting pipelines without a BI stack.
The Manual Way (And Why It Breaks)
Without this tool, developers spend hours manually downloading CSV files, copying data into Excel, and setting up formulas to compute retention. You’ll find yourself pasting activity logs into a master sheet, creating pivot tables, and formatting cells to highlight trends. This process is repetitive and error-prone — the kind of work that slows down data analysis cycles and shifts focus away from insights. It’s especially tedious when you need to run the same calculations across multiple periods or datasets. The result is often a cluttered Excel workbook that’s hard to maintain and update. That’s where python spreadsheet automation can step in.
The Python Approach
Here’s a small snippet that shows how to compute a basic weekly retention matrix using Python. It’s a simple way to get started with csv data processing, and it mimics some of the logic the full tool handles. This code reads signups and activity data, groups users by signup week, and counts how many users returned in each subsequent week.
import pandas as pd
from datetime import datetime, timedelta

# Load signups and activity data
signups_df = pd.read_csv('signups.csv')
activity_df = pd.read_csv('activity.csv')

# Convert date columns to datetime
signups_df['signup_date'] = pd.to_datetime(signups_df['signup_date'])
activity_df['activity_date'] = pd.to_datetime(activity_df['activity_date'])

# Merge the two datasets
merged_df = pd.merge(signups_df, activity_df, on='user_id', how='left')

# Determine cohort week (rounded to start of the week)
merged_df['cohort_week'] = merged_df['signup_date'].dt.to_period('W').dt.start_time

# Compute retention: count how many users were active in each week after signing up
retention_matrix = merged_df.groupby(['cohort_week', 'activity_date']).size().unstack(fill_value=0)

# Calculate weekly retention rates
retention_matrix = retention_matrix.div(retention_matrix.iloc[:, 0], axis=0) * 100

# Print out the matrix
print(retention_matrix)
View full code with error handling: https://oddshop.work/blog/spreadsheet-retention-dashboard-generator-1-guide/
This code is a starting point, but it doesn’t include formatting, Excel export, or summary metrics — tasks that make python excel automation more valuable at scale. It also assumes fixed data column names and doesn’t handle edge cases like overlapping dates or missing data. You’d still need to manually create charts or dashboards.
What the Full Tool Handles
- Reads user signup dates and activity logs from CSV files
- Calculates retention percentages on a weekly or monthly basis
- Generates a fully formatted Excel workbook with a visual cohort matrix
- Applies conditional formatting to quickly identify retention trends
- Exports a summary sheet showing overall retention rate and key metrics
- Handles edge cases like missing data or irregular date formats
This tool streamlines the python spreadsheet automation workflow by taking care of formatting, exporting, and generating visual summaries — everything you’d normally have to code manually.
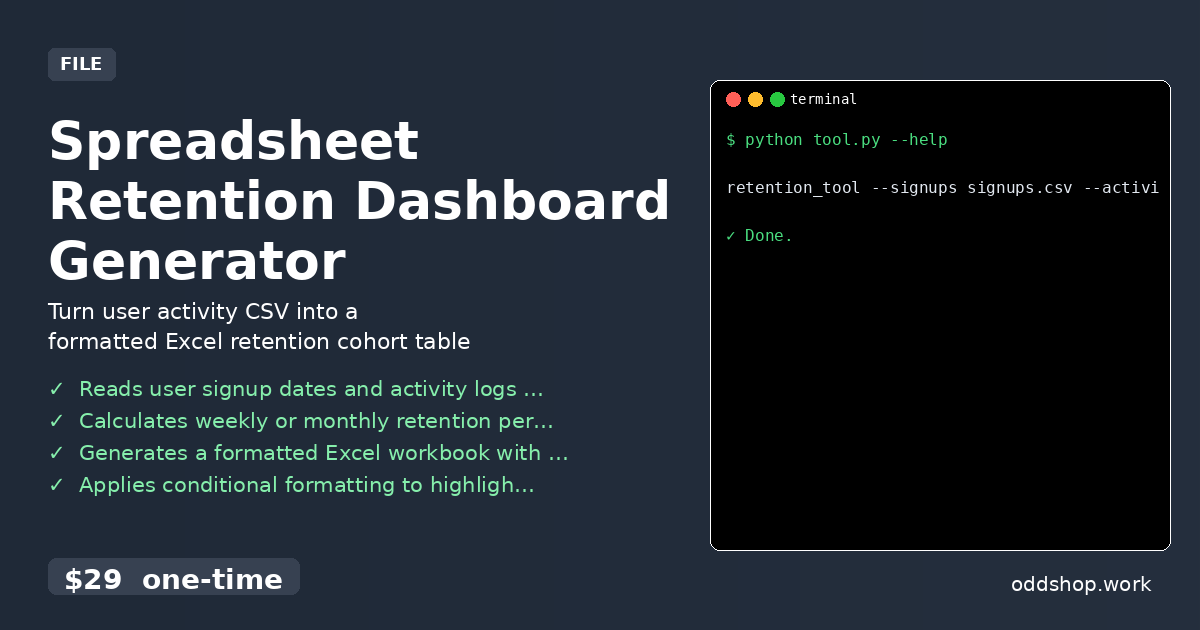
Running It
retention_tool --signups signups.csv --activity activity.csv --output retention_report.xlsx --period monthly
View full code with error handling: https://oddshop.work/blog/spreadsheet-retention-dashboard-generator-1-guide/
The --signups and --activity flags point to your input CSVs, while --output sets the name of the Excel file. The --period flag controls whether to analyze retention on a weekly or monthly basis. The output is a polished Excel workbook with a retention matrix and summary metrics.
Get the Script
You don’t need to build this from scratch — skip the manual work and use the full tool.
Download Spreadsheet Retention Dashboard Generator →
$29 one-time. No subscription. Works on Windows, Mac, and Linux.
Built by OddShop — Python automation tools for developers and businesses.